Trajectory Analysis
Different scripts I use to analyze the simulations of pentameric ligand-gated ion channels are provided here. In future updates these scripts will be applicable to any type of membrane protein.
In almost all the cases the calculation starts from a pdb and a corresponding trajectory file. To reduce the memory requirements and loading times please strip away anythin but the protein from the input files (Depending on the size of the trajectory vmd might crash unexpectedly). Also periodic boundary treatment of the trajectories and fitting to the z axis should be done before running any of the analysis tools.
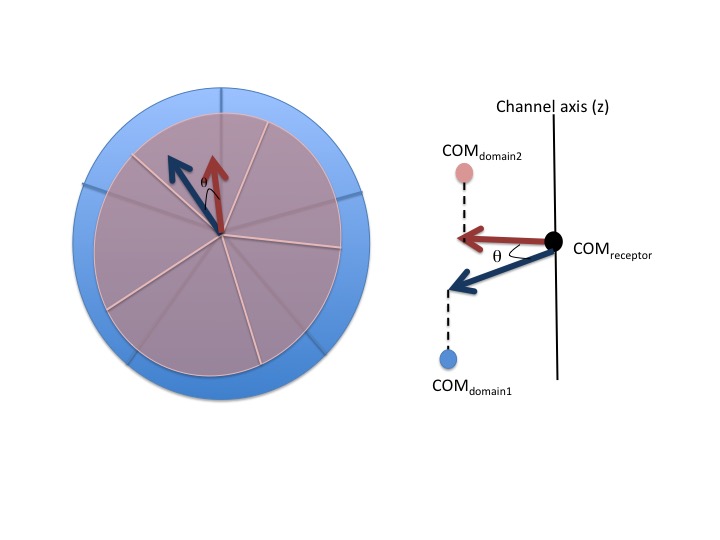
Domain-Twist
The script calculates the angle between two domains using the center of masses (COM). COM of each domain is projected onto the xy plane perpendecilar to the channel axis. With this convention the angle is defined between the vectors drawn from COM of the receptor to the COM of each domain.
Requirements:
VMD
How to Use:
Run the script with your input parameters.
./twist.sh pdb traj output domain1 domain2
- pdb: name of the pdb file
- traj: name of the trajectory file (format required multi pdb (can be easily modified to read other traj files))
- output: name of the output file
- domain1: Residue selection in VMD format for domain 1 prodived with underscores instead of spaces; resid_211_339 (i.e. transmembrane domain residues of GluCl)
- domain2: Residue selection for domain 2. Same syntax as domain 1 applies; resid_1_210 (i.e. Extracellular domain of GluCl )
Output Format: Tab seperated file with 6 column: Frame (Time), average angle over 5 subunits, indivudual angles for each chain.
Example: Within the directory where twist.sh script is located run
bash twist.sh /path/to/examples/GluCl.pdb /path/to//examples/GluCl_md4.xtc twist.dat resid_211_to_339 resid_1_to_210
The output you will get contains a reduced version of the data presented in artcile Yoluk et al.(2015).
KNOWN ISSUES
- Trajectory and pdb files should be aligned so that the z component of the principal axes is parallel to the pore.
- Fitting and periodic boundary should be handled before.
- Selections should be provided without any spaces, with underscores: i.e.: resid_211_to_339. Provide only the residue ids. The script selects the protein and the Calpha atoms by default.
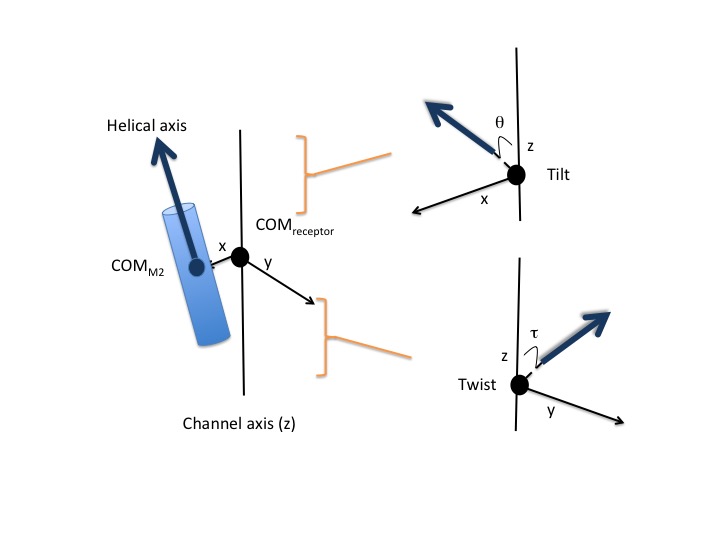
Helix Angles: Tilt & Twist
This script calculates the tilt angle of the transmembrane helices relative to the channel axis in pentameric ligand-gated ion channels. In order to get comparable projections of helical axes, a reference structure is aligned to the center of mass of each M2 helix prior to the calculation (pdb file provided is taken as reference). X axis is defined between the center of mass of M2 helix and the center of mass of the receptor. Z axis is defined as the channel axis and finally Y axis taken as the vector normal to the XZ plane. With these axes definitions, the tilt angle is calculated between the projected helical axis onto XZ plane and Z axis and the twist angle between the projected helical axis onto YZ plane and Z axis. To summarize tilt angle represents the seperation of the M2 helices from the channel axis and the twist angle represents the radial movement.
Requirements:
VMD, Orient and lapack packages for VMD
How to Use (Twist):
Run the script with
./helix_twist.sh pdb traj output helix
- pdb: name of the pdb file
- traj: name of the trajectory file (format required .xtc)
- output: name of the output file
- helix: Residue selection in VMD format for transmembrane helix; resid_242_265 (i.e. transmembrane domain residues of GluCl)
Output Format: Tab seperated file with 6 column: Frame (Time), average angle over 5 subunits, indivudual angles for each subunit.
Example: You can test the scripts with the sample trajectory and the pdb provided in the examples folder. To calculate the angle of the gating helix use this selection resid_242_265.
KNOWN ISSUES
- Trajectory and pdb files should be aligned so that the z component of the principal axes is parallel to the pore.
- Fitting and periodic boundary should be handled before.
- Selections should be provided without any spaces, with underscores: i.e.: resid_211_to_339. Provide only the residue ids. The script selects the protein and the Calpha atoms by default.
How to Use (Tilt):
Run the script with
./helix_twist.sh pdb traj output helix
- pdb: name of the pdb file
- traj: name of the trajectory file (format required .xtc)
- output: name of the output file
- helix: Residue selection in VMD format for transmembrane helix; resid_242_265 (i.e. transmembrane domain residues of GluCl)
Output Format: Tab seperated file with 6 column: Frame (Time), average angle over 5 subunits, indivudual angles for each subunit.
Example: You can test the scripts with the sample trajectory and the pdb provided in the examples folder. To calculate the angle of the gating helix use this selection resid_242_265.
KNOWN ISSUES
- Trajectory and pdb files should be aligned so that the z component of the principal axes is parallel to the pore.
- Fitting and periodic boundary should be handled before.
- Selections should be provided without any spaces, with underscores: i.e.: resid_211_to_339. Provide only the residue ids. The script selects the protein and the Calpha atoms by default.
Ca-Ca distance
Measuring Ca distance is a trivial task using any gromacs tools. However with pentameric symettry, it is possible that the minimum distance between two residues is not always the desired outcome. To overcome this, I had to create an index file with at least 10 entries and loop over it. Well, same calculation with VMD is more flexible and does not require an extra index file. Therefore I prefer to use VMD for distance analysis over GROMACS tools in some cases.
Requirements:
VMD
How to Use:
Run the script with
./distance.sh pdb traj output type residue1 residue2
- pdb: name of the pdb file
- traj: name of the trajectory file (format required .xtc)
- output: name of the output file
- type: (intersubunit or intrasubunit)
- residue1: residue number
- residue2: residue number
Output Format: Tab seperated file with 6 column: Frame (Time), average distance over 5 subunits, indivudual measurements from each subunit.
KNOWN ISSUES
- Trajectory should be fixed for periodic boundary conditions.
- Type intersubunit not written yet.
- By default script calculates the CA distances.
Salt Bridge Analysis
VMD Timeline Plugin provides a beatiful interface for salt bridge analysis over a trajectory. You can obtain the data matrix for plotting in the desired format. The scripts under this section takes salt bridge analysis data of two simulations, calculates the percantage value for each residue pair and outputs one joint file for bar plot representation. Usually the data is noisy, so you want to apply some sort of a filter in order to get catch only relevant changes.
Requirements:
R, python 2.7
How to Use:
Run the script with:
./salt_bridge.sh sim1 sim2 length
- Sim1: VMD Timeline Salt Bridge data
- Sim2: VMD Timeline Salt Bridge data
- length: Simulation length
Output Format: Final outut is a tab seperated file (merged.txt) where first coulumn represents the residue pair, second column sim1 and third coulmn sim2.
Example: Copy the example salt bridge outputs from examples/salt_bridges folder to this folder and run
bash salt_bridge.sh sim1.dat sim2.dat 502
KNOWN ISSUES
- Double entries for residue pairs exist because VMD reports the existence of salt bridges based on atoms not residues. ASP and ARG residues for example can have multiple salt bridge contacts. As a result the value reported for a saltbridge may exceed 100%. Requires normalization.
- Simulations are assumed to be of equal length.
- The data and the run scripts must be located at the same folder.
Secondary Structure Sequence Logos
The conventional way of representing the secondary structure data is to use 3D surface mapping. I have been searching for another way to represent the data since comparing these colored plots with each other did not feel quantitave. I came across a tutorial on MBG Clusters page which represented the secondary structure data in a similar fashion as DNA/RNA/Protein sequences. For an example see the supplementary material of Yoluk et al. (2015).
Requirements:
How to Use:
Before running the script set the variables for $weblogo and $ss_traj .
weblogo=/path/to/weblogo
ss_traj=/path/to/ss_traj.tcl
Run the script with
./run_stride_seqLogo.sh pdb traj output_name resnr
Thhe initial dat is necessary because the suggested way to set variable above will not allow the run_stride_seqLogo.sh to access them.
Output format: Output is a pdf file. Length of the file is set by the sequence length.
Example: within the ss_stride folder run
./run_stride_seqlogo.sh ../../examples/GluCl.pdb ../../examples/GluCl_md4.xtc test 339
The output you will get is similar to what I presented in the article Yoluk et al. (2015). In the article I have displayed only a short region. But the output you will get test_seqLogo.pdf contains the full sequence. When you open the file you will spot the individual beta strands and transmembrane helices right away.