HOLE Analysis/Visualisation scripts
HOLE is an application to calculate the pore radius. By the time I have written this scripts, I only had acces to linux binaries of HOLE. It was quite frustrating to copy data back and forth to get a simple rendered image. It was also cumbersome to handle thousands of tiny files for plotting. Hence the scripts provided here are the products of the need at the time. I have realized HOLE has got a whole new site and more binaries as of 2014. The plotting script works with the output from versions before 2014, I have not checked the script yet against the new distributions.
Plotting
Python scripts to extract information from the HOLE log files.
How to Use:
You can call the log reader with:
python path/to/log_reader.py -h
You have three interaction types with the logs.
“minrad”: This option will print the minimum radius with it’s positions. I often see papers presenting only the minimum radius over time. However the position of the minimum radius might vary a lot in a simulation.
Output format: Tab delimited file. “Time Minimum_Radius Position”
“frame”: This option allows you to print information only from a certain time frame. Required arguments are “time”.
Output format:Tab delimited file. “Position Radius”
“region”: This option will allow you to calculate the average pore radius over time. This is useful for example when you want to plot the change around 9’ region over time. Required arguments are “llim” (lower limit of the desired region), “ulim” (upper limit of the desired region), “step” (Time step used in calculation).
Output format: Tab delimited file. “Time Average_Radius StdDev”
Example:
python /path/to/log_reader.py --log "/path/to/examples/log" --output minimum_radius.xvg --type minrad
KNOWN ISSUES - When outputting only a certain time frame, the script will still read through all the log files. It might take some time if you have too many log files. - Any file with the extension .log will be picked up. - Script does not yet output the matrix containing all the information from all the log files. In a future update you will be able to obtain 2D plot, Time vs Position colored with pore radius.
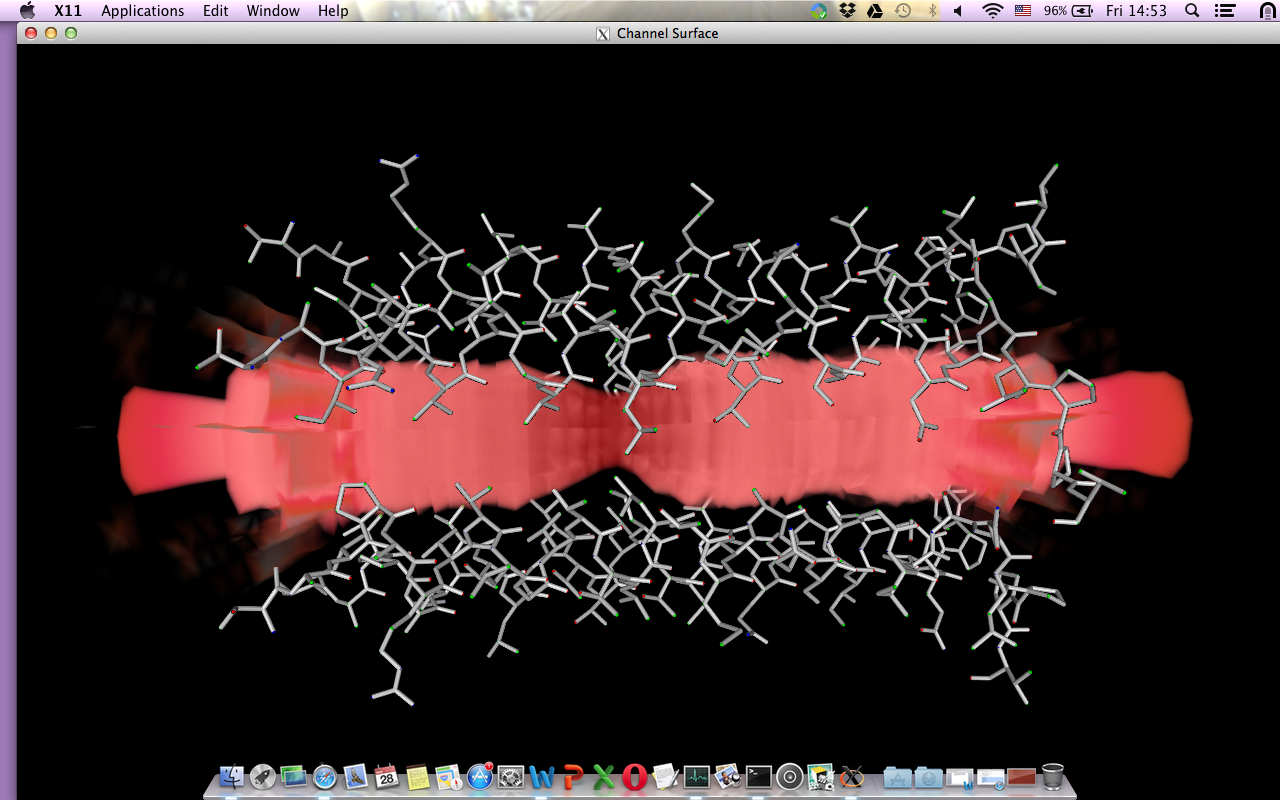
Pore Visualisation
The VTK application is a project I started for a course. The idea was and still is to browse through the rendered images just using one application. The current way I get a rendered image of the pore consists of several applications. And again the binaries I had were only for linux at the time. This VTK application would make use of the log outputs and you will have the possiblity of making an animated gif , for example.
How to Use:
This script calculates the Twist angle between transmembrane domain and the extracellular domain of ligand-gated ion channels. As long as two domains are aligned on z compoment of the principal axes in theory it should work. Note ligand-gated ion channels I work with has 5 subunits. Script works with 5 chains for now.
Run the script with ./twist.sh but do modify the arguments with your own inputs in the following order: (0) pdb file (1) trajectory file (2) output file (extension set as .dat if you want to modify change it in the .tcl file) (3) transmembrane domain selection (4) extracelluar domain selection
– Trajectory and pdb files should be aligned so that the z component of the principal axes is parallel to the pore. The fitting of the trajectory should be done before running this script using Calpha atoms of the protein to the pdb file.
– Selections should be provided without any spaces, with underscores: i.e.: resid_211_to_339. Provide only the residue ids. The script selects the protein and the Calpha atoms by default.
– Output file consists of 6 columns: frame, average angle of 5 subunits, indivudual angles of chain A-E. Frame corresponds to the time of the trajectory, but remember that with gromacs trajectories frame 0 is the pdb file loaded, frame 1 is the 0ns of the trajectory.
vtkPore Application
The purpose of this application is to create series of images to quickly visualise the pore radius with it’s surrounding residues.
- The current version reads only one pdb file, named TM2.pdb
- You’ll need python 2.7 and vtk to run the program.